Electricity prices
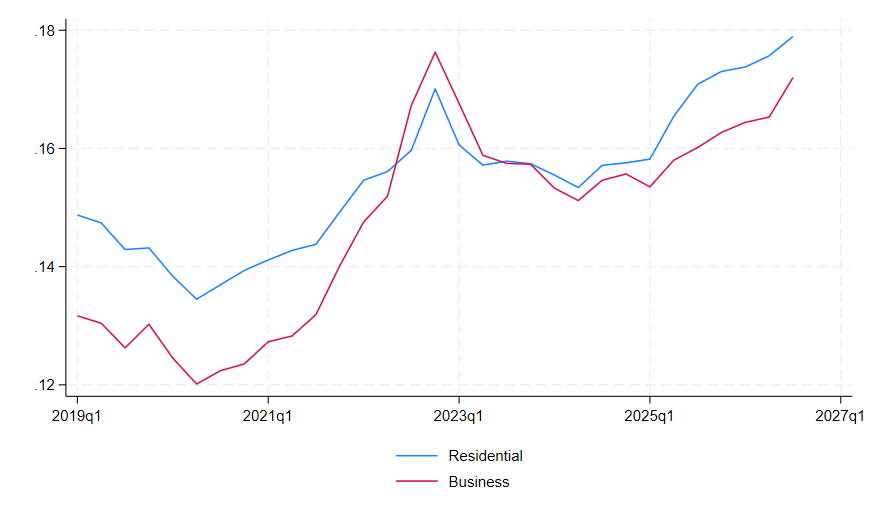
Q3 2026 update: The average electricity price in the world is USD 0.179 kWh for residential users and USD 0.172 USD per kWh for businesses.
The highest residential electricity prices are in Europe at USD 0.260 per kWh and the lowest are in Asia with USD 0.088.
Africa (0.141), Oceania (0.253), North America (0.158), and South America (0.220) are in between.
The highest business electricity prices are in Oceania at USD 0.266 per kWh and the lowest prices are in Africa (0.134) and Asia (0.114).
On the other continents: Europe (0.226), North America (0.162), and South America (0.215).
See the price averages across 35 country groups.
Download data
API
Forecast
World Average Electricity Prices, USD / kWh
The world average electricity price increased by 1.97 percent for households and by 4.71 percent for businesses since Q2 2026. On an annual basis, household rates increased by 5.29 percent and business rates increased by 7.5 percent since Q3 2025.
European Average Electricity Prices, USD / kWh
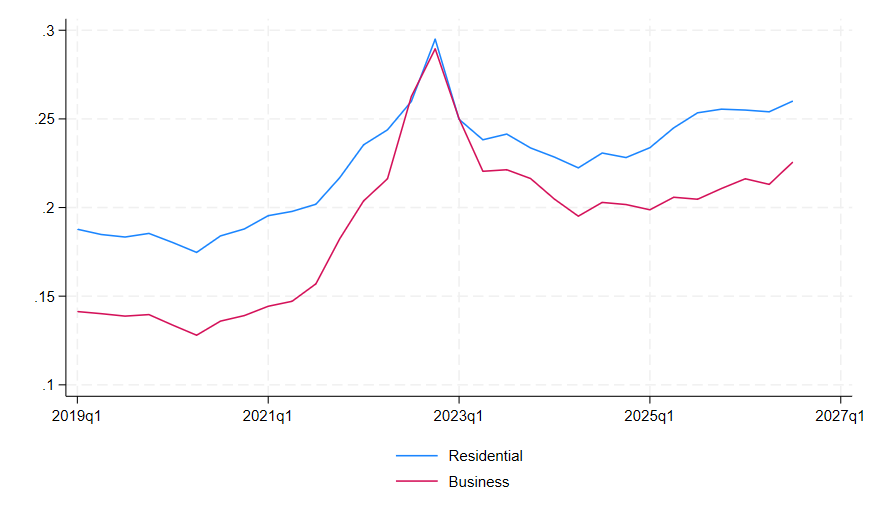
Electricity prices in Europe increased by 2.4 percent for households and by 5.95 percent for businesses compared to Q2 2026. Annually, European electricity rates increased by 2.63 percent for households and by 10.3 percent for businesses since Q3 2025.
Percent Change in Electricity Prices by Continent
| Continent | Households (quarterly change) |
Households (annual change) |
Business (quarterly change) |
Business (annual change) |
|---|---|---|---|---|
| Africa | 1.05% | 5.12% | 0.11% | 5.94% |
| Asia | -0.27% | 3.44% | 2.94% | 3.65% |
| Europe | 2.40% | 2.63% | 5.96% | 10.30% |
| North America | 3.65% | 9.22% | -2.19% | 1.27% |
| Oceania | -2.92% | 5.41% | 0.14% | -3.01% |
| South America | 3.10% | 7.61% | 5.86% | 7.91% |
Notable Electricity Price Changes in Q3 2026
As can be expected, the energy shock produced by the war in Iran lifted electricity prices in many parts of the world. The effect is stronger in countries with liberalized markets such as in Europe and particularly in countries that rely on natural gas to produce electricity. The pressure was also felt in small less developed economies across Asia, Latin America and Africa. Also, the impact on business rates has been greater than on residential rates eroding competitiveness. By now, the world average prices exceed those reached after the onset of the war in Ukraine. Looking at the charts above, it seems that the trajectory of prices is upward with reinforcement from frequent large energy price shocks. With growing demand from electrification and lagging increase in supply, the upward trend is likely to continue.Compare Electricity Prices by Country
The table shows the average residential and business electricity rates for the period from 2023 to 2026. Such averages are better for comparing countries as they avoid quarter-to-quarter price volatility. You can also see a world map of electricity prices. Download data API Forecast| Countries | Residential electricity rates in USD/kWh, 2023–2026 average |
Business electricity rates in USD/kWh, 2023–2026 average |
|---|---|---|
| Bermuda | 0.464 | 0.263 |
| Ireland | 0.453 | |
| Cayman Islands | 0.416 | 0.373 |
| Italy | 0.415 | 0.408 |
| Belgium | 0.409 | 0.266 |
| Germany | 0.409 | 0.284 |
| UK | 0.405 | 0.444 |
| Liechtenstein | 0.397 | 0.271 |
| Switzerland | 0.367 | 0.284 |
| Austria | 0.356 | 0.294 |
| Denmark | 0.352 | 0.228 |
| Czech Republic | 0.350 | 0.228 |
| Cyprus | 0.348 | 0.312 |
| Bahamas | 0.346 | 0.371 |
| Cape Verde | 0.330 | 0.204 |
| Barbados | 0.315 | 0.327 |
| Guatemala | 0.301 | 0.189 |
| Estonia | 0.294 | 0.167 |
| Jamaica | 0.290 | 0.242 |
| Lithuania | 0.288 | 0.182 |
| Netherlands | 0.287 | 0.221 |
| Latvia | 0.279 | 0.165 |
| France | 0.276 | 0.186 |
| Luxembourg | 0.260 | 0.218 |
| Australia | 0.259 | 0.244 |
| Spain | 0.259 | 0.134 |
| Greece | 0.257 | 0.245 |
| El Salvador | 0.255 | 0.225 |
| Uruguay | 0.255 | 0.126 |
| Sweden | 0.247 | |
| Portugal | 0.240 | 0.160 |
| Singapore | 0.236 | 0.261 |
| Poland | 0.236 | 0.326 |
| Sierra Leone | 0.234 | 0.308 |
| Romania | 0.233 | 0.249 |
| Honduras | 0.232 | 0.231 |
| Chile | 0.231 | 0.172 |
| Slovenia | 0.229 | 0.191 |
| Japan | 0.227 | 0.200 |
| Mali | 0.224 | 0.161 |
| Belize | 0.220 | 0.173 |
| Kenya | 0.218 | 0.175 |
| Slovakia | 0.216 | 0.280 |
| South Africa | 0.215 | 0.108 |
| Rwanda | 0.213 | 0.079 |
| New Zealand | 0.213 | |
| Colombia | 0.212 | 0.208 |
| Philippines | 0.211 | 0.158 |
| Aruba | 0.210 | 0.313 |
| Burkina Faso | 0.209 | 0.218 |
| Gabon | 0.208 | 0.176 |
| Togo | 0.200 | 0.182 |
| Andorra | 0.196 | 0.178 |
| USA | 0.190 | 0.150 |
| Israel | 0.188 | 0.114 |
| Peru | 0.187 | 0.162 |
| Hong Kong | 0.184 | 0.175 |
| Senegal | 0.183 | |
| Croatia | 0.183 | 0.178 |
| Moldova | 0.181 | 0.163 |
| Iceland | 0.181 | 0.088 |
| Panama | 0.177 | 0.198 |
| Finland | 0.177 | 0.122 |
| Nicaragua | 0.176 | 0.216 |
| Costa Rica | 0.171 | 0.228 |
| Uganda | 0.171 | 0.115 |
| Norway | 0.169 | 0.117 |
| Brazil | 0.166 | 0.134 |
| Bulgaria | 0.157 | 0.157 |
| Ghana | 0.151 | 0.140 |
| Cambodia | 0.150 | 0.116 |
| Malta | 0.149 | 0.166 |
| Namibia | 0.145 | |
| Mauritius | 0.136 | 0.139 |
| Ivory Coast | 0.132 | 0.236 |
| Swaziland | 0.132 | 0.093 |
| Serbia | 0.131 | 0.145 |
| N. Maced. | 0.130 | 0.260 |
| Madagascar | 0.130 | 0.200 |
| Mozambique | 0.127 | 0.080 |
| South Korea | 0.126 | 0.119 |
| Thailand | 0.125 | 0.127 |
| Canada | 0.123 | 0.110 |
| Morocco | 0.121 | 0.111 |
| Montenegro | 0.120 | |
| Albania | 0.119 | 0.146 |
| Dom. Rep. | 0.115 | 0.171 |
| Armenia | 0.113 | 0.111 |
| Sri Lanka | 0.112 | 0.088 |
| Hungary | 0.112 | 0.371 |
| Mexico | 0.110 | 0.212 |
| Bosnia & Herz. | 0.110 | 0.121 |
| Lesotho | 0.109 | 0.023 |
| Maldives | 0.103 | |
| Taiwan | 0.099 | 0.191 |
| Ecuador | 0.097 | 0.096 |
| Botswana | 0.094 | 0.125 |
| Argentina | 0.092 | 0.098 |
| Indonesia | 0.090 | 0.069 |
| Tanzania | 0.090 | 0.093 |
| Jordan | 0.090 | 0.141 |
| Malawi | 0.089 | 0.156 |
| Belarus | 0.088 | 0.116 |
| Ukraine | 0.085 | 0.166 |
| Cameroon | 0.085 | 0.179 |
| UAE | 0.080 | 0.110 |
| Vietnam | 0.078 | 0.078 |
| India | 0.076 | 0.122 |
| China | 0.076 | 0.109 |
| Russia | 0.070 | 0.104 |
| Venezuela | 0.069 | 0.081 |
| Georgia | 0.069 | 0.108 |
| Turkey | 0.067 | 0.135 |
| Tunisia | 0.067 | 0.116 |
| DR Congo | 0.066 | 0.077 |
| Pakistan | 0.063 | 0.152 |
| Bangladesh | 0.063 | 0.102 |
| Kazakhstan | 0.058 | 0.078 |
| Trinidad & Tobago | 0.057 | 0.053 |
| Paraguay | 0.056 | 0.047 |
| Saudi Arabia | 0.052 | 0.070 |
| Afghanistan | 0.052 | 0.094 |
| Suriname | 0.051 | |
| Malaysia | 0.049 | 0.129 |
| Bahrain | 0.048 | 0.079 |
| Azerbaijan | 0.048 | 0.064 |
| Nepal | 0.042 | 0.067 |
| Algeria | 0.041 | 0.035 |
| Kuwait | 0.040 | 0.071 |
| Uzbekistan | 0.040 | 0.070 |
| Nigeria | 0.036 | 0.050 |
| Laos | 0.035 | |
| Qatar | 0.032 | 0.036 |
| Oman | 0.031 | 0.187 |
| Burma | 0.025 | 0.111 |
| Zambia | 0.024 | 0.041 |
| Egypt | 0.023 | 0.039 |
| Sudan | 0.019 | 0.042 |
| Angola | 0.016 | 0.013 |
| Bhutan | 0.015 | 0.019 |
| Iraq | 0.015 | 0.045 |
| Kyrgyzstan | 0.015 | 0.040 |
| Cuba | 0.014 | |
| Ethiopia | 0.006 | 0.019 |
What Explains Electricity Price Differences by Country
Looking at the table above, one observes very substantial differences in electricity prices around the world. The most expensive countries in terms of electricity prices are a mix of two kinds. One kind is remote islands like Bermuda and the Bahamas that rely on fossil fuels for electricity generation with no option to import electricity from a neighbor. The high cost of electricity generation in those countries explains the high prices. The second kind are advanced countries, primarily in Europe, where high prices are due to high taxes and high transmission and distribution costs. The lowest residential electricity prices are in Ethiopia, Sudan and a few other countries where one kWh of electricity costs less than USD 0.10. Some of these counties subsidize their electricity prices as they are rich in energy resources. Others, such as Ethiopia, are pressed to subsidize prices as incomes in the country are very low and electricity is an essential product. Of the big economies, prices in the U.S. are close to the world average whereas China’s electricity prices are about half of those in the U.S. In contrast, prices are much higher in Japan and, especially, in Germany. Note also that business electricity prices are generally lower than household electricity prices, reflecting the effort to maintain industrial competitiveness. The U.S. Energy Information Administration has an interesting overview explaining factors explaining electricity prices. Download data API ForecastBenchmark Data Parameters
The prices are per kWh and include all items in the electricity bill such as the distribution and energy cost, various environmental and fuel cost charges and taxes. The residential prices are calculated using the average annual household electricity consumption per year and for businesses, we use 1,000,000 kWh consumption per year. We do, however, calculate several data points at different levels of consumption for both households and businesses.Price distribution in Q3 2026
The chart shows the global average residential electricity prices at several levels of electricity consumption: at 25 percent of the average annual consumption, 50 percent, and so forth. The distribution is U-shaped: prices are higher at low and high levels of electricity consumption. Often electricity bills have a fixed payment which raises the per kWh price at low levels of electricity consumption. At the same time, many countries with regulated prices have lower rates for poorer households which explains the higher global average at higher levels of electricity consumption.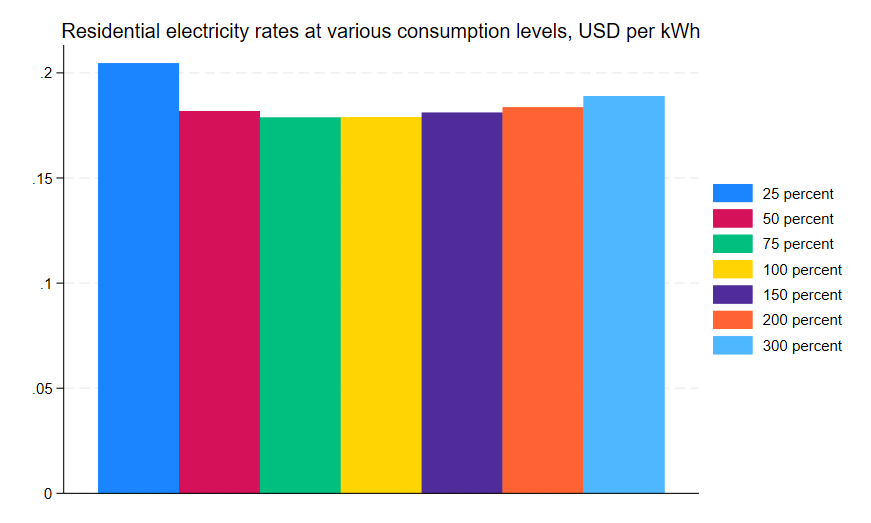 On the following chart are the global average electricity prices by firm size.
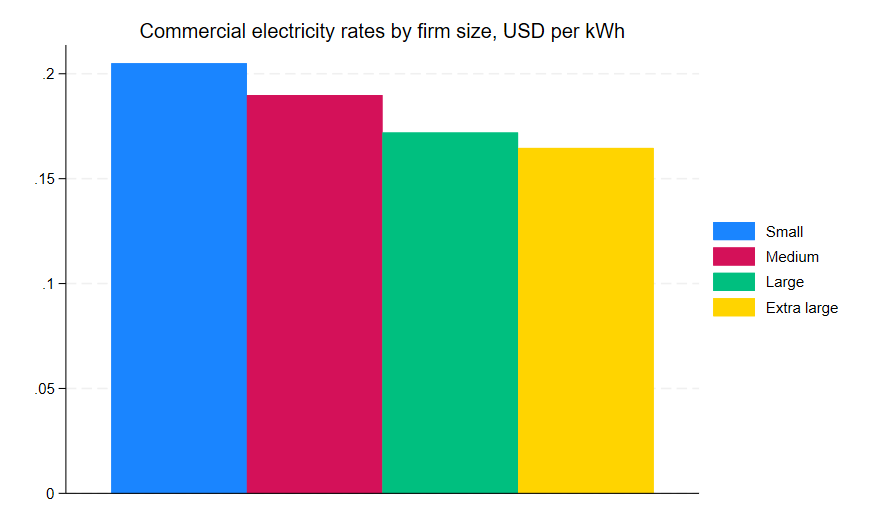
Prices uniformly decline with firm size due to volume discounts.
On the following chart are the global average electricity prices by firm size.
Prices uniformly decline with firm size due to volume discounts.